Automatically insert your project plots
matplotlib provides already a plot directive to generate and include plots inside a read the docs document. For that, you will need to add the extension 'matplotlib.sphinxext.plot_directive' in your conf.py and use one of the following alternatives:
Put the plot code in a separate file:
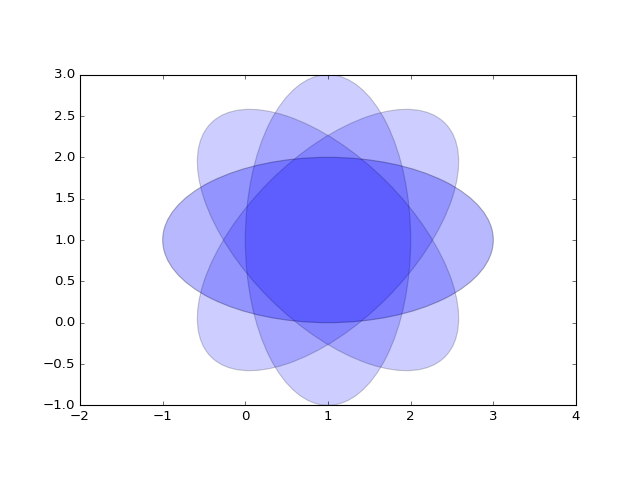
.. plot:: plots/example_plot.py
  :include-source:
from pylab import *
from matplotlib.patches import Ellipse

delta = 45.0 # degrees

angles = arange(0, 360+delta, delta)
ells = [Ellipse((1, 1), 4, 2, a) for a in angles]

a = subplot(111, aspect='equal')

for e in ells:
    e.set_clip_box(a.bbox)
    e.set_alpha(0.1)
    a.add_artist(e)

xlim(-2, 4)
ylim(-1, 3)

show()
(Source code, png, hires.png, pdf)

Inline code inside a block like:
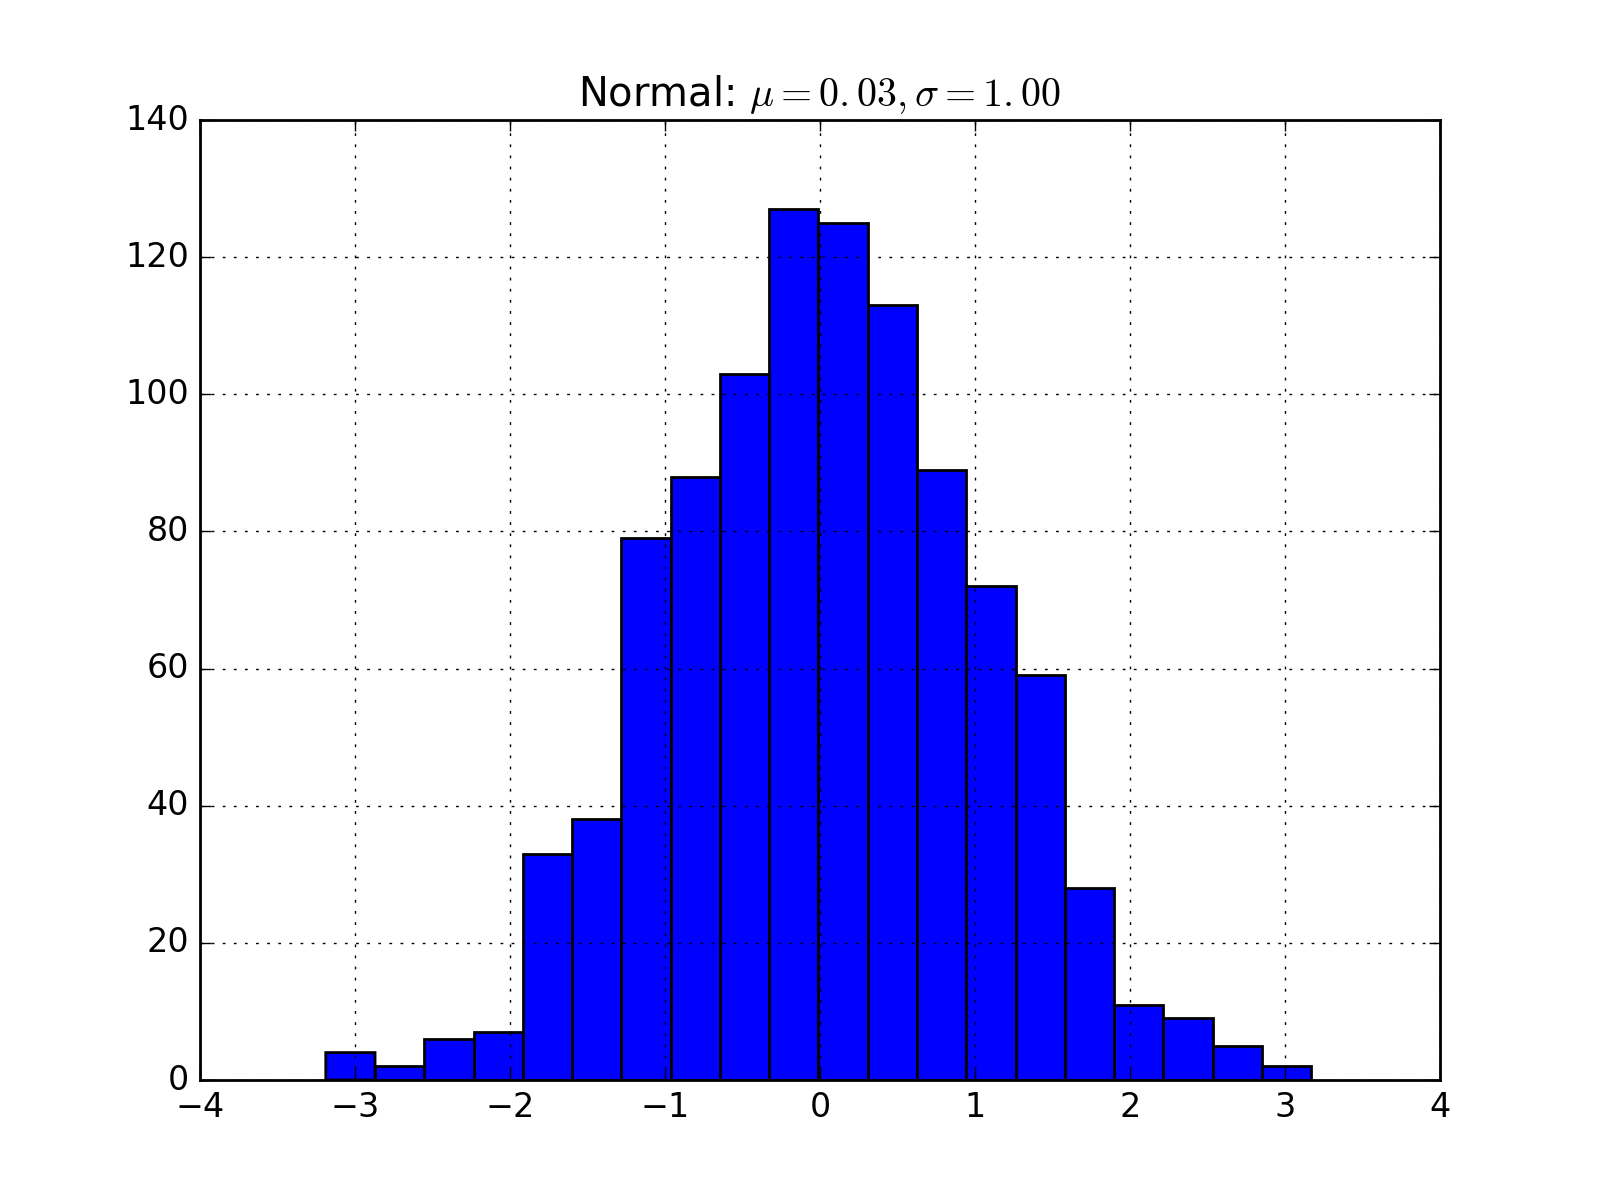
.. plot::

   import matplotlib.pyplot as plt
   import numpy as np
   x = np.random.randn(1000)
   plt.hist( x, 20)
   plt.grid()
   plt.title(r'Normal: $\mu=%.2f, \sigma=%.2f$'%(x.mean(), x.std()))
   plt.show()
Will generate
(Source code, png, hires.png, pdf)
